Freematics Data Charting Service is set up to provide users of Arduino OBD-II data logger kits an easier way to review logged data. Simply by choosing and uploading a log file (with CSV extension), charts for OBD-II data and a GPS track will be illustrated on the spot in web browser. The service is for beta testing now and is being improved actively.
The rendering of GPS track in web browser requires Google Earth. Please install Google Earth if you don’t have it.
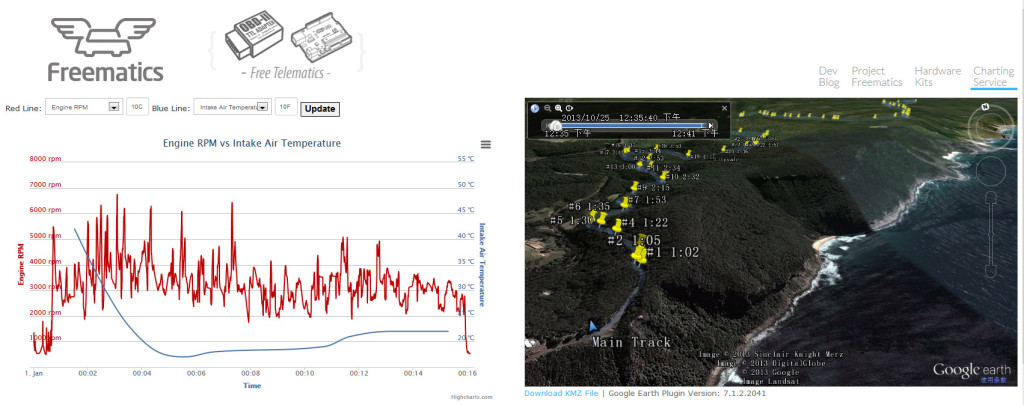
Some tips about the service:
- Once you see the map, hold Shift or Ctrl key and then scroll with mouse to adjust the view point angle. This is something Google Maps don’t provide.
- The yellow marks in the map are the brake points in the track.
- The URL of chart/map page is static so you can share it with others
If you have got your log files ready, head up for Freematics Data Charting Service now. Even if you don’t have anything, you can still view some sample data there.