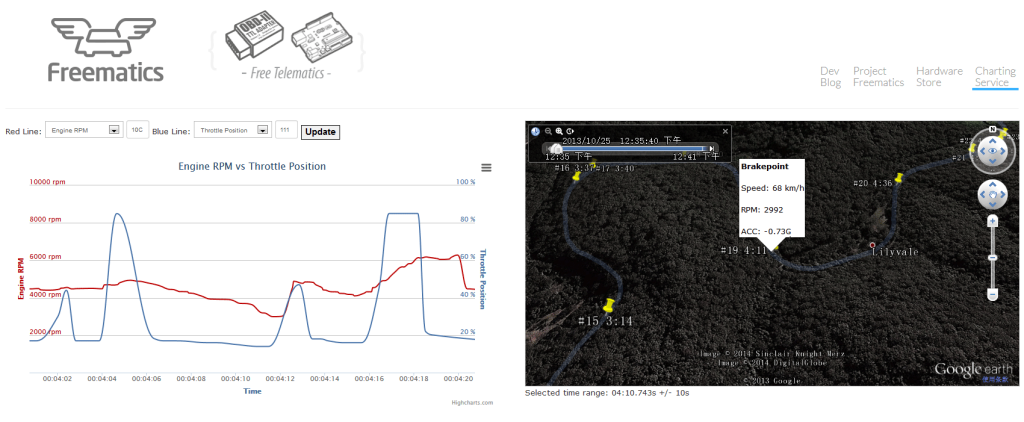
Just spent some time on Freematics Charting. Besides tweaking up the performance a little bit, a new feature was added. By selecting two points on the driving track in the map window, the data chart on the left will automatically zoom into that range. By double clicking a points on the track, the chart will zoom into that point of time and 10 seconds before and after that point. Now the chart and the track on the map can be kind of synchronized.
Click here to view some sample data on Freematics Charting. Don’t forget you are free to have you own.